Search in ideas for "bitcoin euro"


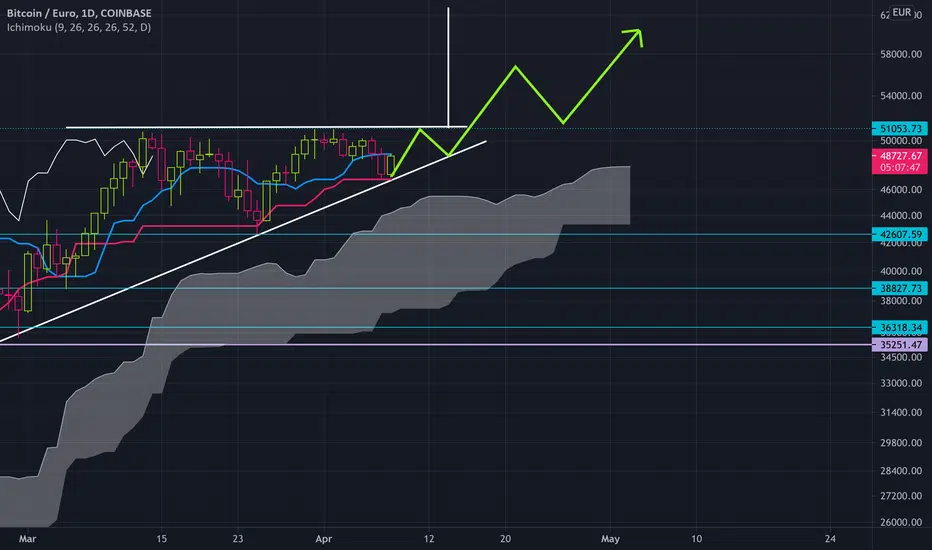
Bitcoin / Euro - breakout upwardsWe have what looks like a breakout upwards here. Time to try a buy!
STOP:
We can put a stop under the last swing low of the triangle
EXIT:
I'll be moving a stop up under the swing lows to get as much of this trend as possible.
Good stuff I hope. Good luck!

Bitcoin/Euro viewBitcoin/Euro view
Because a true bull market must be seen in all currencies,
on 27/3/14 lost its 2013 uptrend line, its trying to regain
it after breaking out of the large (top) triangle,
hitting resistance at 500, and correcting to 50% and 0.618 retracemenet..
under its 200 sma, holding its 20/5 uptrend line, and directional line.
Failure to rise above, breaking the upward slope,
will result in falling down to channel bottom.

Analysis Bitcoin - Euro on DailyBitcoin - Euro Daily
On weekly: Uptrend by Ichimoku confirmations: SSA up, TS, KS up and Chiko above Candles.
On Daily: Ranging by Ichimoku confirmations: SSA and SSB flat, KS flat. Chiko touching the candles. Price is moving in P-wave; Higher lows into resistance.
Im waiting for Chiko above candles, KS and SSB up for buy.
Bullish scenario: Price breaks p-wave to upside. price can go to 62726 euro.
Bearish scenario: Price breaks p-wave to downside. Price can go to previous support on: 42776 euro.
Bitcoin / Euro Pitchfork experimental ideaDoes Bitcoin / Euro give a new perspective compared to the usual Bitcoin / USD chart?
I drew a Modified Schiff Pitchfork with anchor-points December 2018, November 2021 and November 2022.
It seems to respect the Fib levels and 0.25, 0.5, 0.75, 1.0 levels well. Let´s see how it plays out.

Elliot Wave on Bitcoin EuroThis is my theory on Bitcoin / Euro.
If the uptrend continues it would the create the 3rd leg of an Elliot wave.
Science tells us that this uptrend has to pull back at some at and then that would be the 4th point on the wave from there a reversal back up would signal the 5th.

BTC/EUR, where to buy the dip?Please Support this Idea with LIKE if it is Useful....
BITCOIN/EURO
The price is following an ascending structure, price is in strong momentum so price may continue moving higher without a pullback, but we can't enter in the Impulse we have to wait for a correction to enter, If price makes a correction/pullback and holds above the support I expect the price to move higher.

BTCEUR , Don't miss this opportunity to buy....BITCOIN/EURO
Midterm forecast:
While the price is above the support 4184.50, beginning of uptrend is expected.
We make sure when the resistance at 7297.45 breaks.
If the support at 4184.50 is broken, the short-term forecast -beginning of uptrend- will be invalid.
Trading suggestion:
There is possibility of temporary retracement to suggested Buy Zone (5110.00 to 4184.50), if so, we would set orders based on Price Action and expect to reach short-term targets.
Beginning of entry zone (5110.00)
Ending of entry zone (4184.50)
Entry signal:
Signal to enter the market occurs when the price comes to "Buy zone" then forms one of the reversal patterns, whether "Hammer" or "Trough" , in other words,
NO entry signal when the price comes to the zone BUT after any of reversal patterns is formed in the zone.
To learn more about "Entry signal" and special version of our "Price Action" strategy FOLLOW our lessons:
Technical analysis:
Price is below WEMA21, if price rises more, this line can act as dynamic resistance against more gains.
Relative strength index ( RSI ) is 36.
Take Profits:
TP1= @ 6299.85
TP2= @ 7297.45
TP3= @ 7930.55
TP4= @ 9236.95
TP5= @ 10740.80
TP6= @ 12166.75
TP7= @ 14229.35
TP8= @ 16780.00
TP9= Free

BTCEUR , TP3 hit with 1940139 profit. NEW Buy Opportunity...BITCOIN/EURO
New trading suggestion:
*The price is in an up trend and we forecast the uptrend would continue.
*There is possibility of temporary retracement to suggested support line (6299.85) , if so, traders can set orders based on Price Action and expect to reach short-term targets.
Entry signal:
Signal to enter the market occurs when the price comes to "Buy zone" then forms one of the reversal patterns, whether "Hammer" or "valley" , in other words,
NO entry signal when the price comes to the zone BUT after any of reversal patterns is formed in the zone.
To learn more about "Entry signal" and special version of our "Price Action" strategy FOLLOW our lessons:
Trade Setup:
We opened 9 BUY trade(s) @ 5514.00 based on 'Hammer in D2 time frame' entry method at 2018.04.07.
Total Profit: 1940139 pip
Closed trade(s): 678585 pip Profit
Open trade(s): 1261554 pip Profit
Closed Profit:
TP1 @ 6299.85 touched at 04.12.2018 with 78585 pip Profit.
TP2 @ 7297.45 touched at 04.20.2018 with 178345 pip Profit.
TP3 @ 9730.55 touched at 04.24.2018 with 421655 pip Profit.
78585 + 178345 + 421655 = 678585 pip
Open Profit:
Profit for one trade is 7616.59(current price) - 5514.00(open price) = 210259 pip
6 trade(s) still open, therefore total profit for open trade(s) is 210259 x 6 = 1471813 pip
Take Profits:
TP4= @ 9236.95
TP5= @ 10740.80
TP6= @ 12166.75
TP7= @ 14229.35
TP8= @ 16780.00
TP9= Free
Midterm forecast:
While the level 6299.85 is not broken, the Midterm wave will be uptrend.
Price may also reach 6299.85, if price reaches this level, we may enter by Daily-Trading-Opportunities, this entry depends on personal strategies.
We will close our open trades, if the Midterm level 6299.85 is broken.
Technical analysis:
Price is above WEMA21, if price drops more, this line can act as dynamic support against more losses.
Relative strength index (RSI) is 64.

BTCEUR , Don't miss this opportunity to buy....BITCOIN/EURO
Midterm forecast:
While the price is above the support 4184.50, beginning of uptrend is expected.
We make sure when the resistance at 7297.45 breaks.
If the support at 4184.50 is broken, the short-term forecast -beginning of uptrend- will be invalid .
Trading suggestion:
There is possibility of temporary retracement to suggested Trend Hunter Buy Zone (5110.00 to 4184.50), if so , we would set orders based on Price Action and expect to reach short-term targets.
Beginning of entry zone (5110.00)
Ending of entry zone (4184.50)
Entry signal:
Signal to enter the market occurs when the price comes to "Buy zone" then forms one of the reversal patterns, whether "Hammer" or "Trough" , in other words,
NO entry signal when the price comes to the zone BUT after any of reversal patterns is formed in the zone.
To learn more about "Entry signal" and special version of our "Price Action" strategy FOLLOW our lessons:
Technical analysis:
Price is below WEMA21, if price rises more, this line can act as dynamic resistance against more gains.
Relative strength index (RSI) is 36.
Take Profits:
TP1= @ 6299.85
TP2= @ 7297.45
TP3= @ 7930.55
TP4= @ 9236.95
TP5= @ 10740.80
TP6= @ 12166.75
TP7= @ 14229.35
TP8= @ 16780.00
TP9= Free

BITCOIN/ EURO. THROW YOUR HANDS IN THE AIR - THE ROOF IS ON FIREThe main technical graph is Bitcoin in Euro, and yes..
.. the major supports of 52-week SMA and 3-year old trend have been broken.
Feels, this is the roof.. and the roof is on fire.
// we don't need no crypto
let the motherfucker burn
--
Best wishes,
@PandorraResearch Team

BITCOIN/ EURO. THIS IS THE END...The main technical graph is Bitcoin in Euro, and yes..
.. it nears to break the major 52-week SMA and 3-year old trend supports.
Feels, this is it the end.

Bitcoin Euro is €82,000 nextIn this video I go through an idea that may take bitcoin down to the €82,000 region .
I cover the current price action and run through a scenario of bitcoin coming down to the Newley spawned quarterly pivots and faking out at the value area low before coming back up into the range .
The tools I used in the video are quarterly pivots , anchored vwap , Fibonacci, fixed range volume profile and a tpo chart .
Appreciate your following and Good luck with your trading !

Bitcoin euro upwards moving channel!In this chart i see bitcoin moving upwards in the channel. Green lines are support lines and red line is resistance. Breakthrough to the down side of the channel would signal a bearish movement and a test from lower support lines. Bitcoin is moving upwards in the channel and the next resistance will be the red resistance line. Just want to notify anybody checking my chart that I am no expert as I am still learning my self. Feel free to comment and share your opinion!

Bitcoin Euro price prediction!In this chart i believe that Bitcoin has to break the first resistance level so that it can go higher, if it breaks the 1st resistance level after that there are a few more resistance levels. Managing to breaks all the levels would make Bitcoin very bullish. On the other hand, if bitcoin fails to break the first resistance line then it might go downwards towards the first support level. There might also be forming a triple top pattern, which would confirm downwards movement. For the pattern to become valid, bitcoin would have to break the neckline and then it would be valid and the direction would be towards the downside. Just want to notify anybody checking my chart that I am no expert as I am learning Technical Analysis still my self. If you think that my chart has mistakes or you have different opinion than what my chart shows, feel free to share your opinion because I am always willing to learn!

Bitcoin update! Support broken on phase 2 line of hyperwaveBitcoin Euro update!
Support broken both of the decending triangle and the phase 2 line of the hyperwave!

Bitcoin European Session Support BTC finally broke 7700 Support & traded as low as 7600. Is it a confirmed break ? Lets wait for 2 H4 Candles to close. Check the Levels

Bitcoin / Euro - Breakout of triangle upwardsI'm looking for a good way into this potential move up in bitcoin.
Concerns:
The only thing that's really bothering me is that against other currencies bitcoin isn't making this triangle pattern or breakout. however I trust the strength of the euro against btc.
The breakout move is also lacking a little in volume. although it has gained a little from the day before.

Bitcoin/Euro Long on break of daily highs - XBT/EUREntry:
We have a sort of consolidation happening, if we break above that we could get a nice pop up.
Stoploss:
We want to get the stoploss as tight as possible while still being reasonable. If we break the blue trendline the chances are we are heading down. Having a tighter stop will give a better risk to reward. The idea here is to take a slightly higher risk on a smaller stop but for that to be payed for in the long run by the much higher reward that is possible on these bitcoin moves.
Exit:
We will move a stop-loss up under the swing lows of the 4H timeframe. The idea is to ride the trend as long as possible.
Things I'm considering:
- We have an overall uptrend on bitcoin right now.
- On the 4H timeframe we are consolidating and holding above the moving averages.
- We have already broken higher above the last consolidation - breaking the structure of the downward move.
- A break about the consolidation would create a reversed head and shoulders pattern.
Mark

Bitcoin/euro bearish divergenceBitcoin will go to test support line.If it break
Then price will go lower.


